Concept Simulators / Speed and waiting
Database scaling
Caches, replicas and shards against reads, writes and load.
On the roadmap:Beginner · step 6: Scaling one server
Workload
Scaling levers
Busiest machine
240%
Typical latency
timeouts
Database machines
1
Reach the database
20,000/s
Overloaded: requests queue up and time out. Read heavy: raise the cache hit rate (bigger or smarter cache) before adding hardware. Add read replicas to spread the read load.
Your database tier, machine by machine
Shard 1
Primary
240%
Green is comfortable (under 70%), amber is getting tight, red is saturated: requests queue and time out.
Node utilisation (100% = saturated)
What reaches the database
20,000 req/s
18,000 reads · 2,000 writes
Typical latency: timeouts
An illustrative model (a read costs 1 unit, a write 3, one node handles 10,000 units a second), designed to show relative effects, not to predict your production numbers.
In plain words
A database can only do so many operations a second. A cache takes reads away from it, replicas share the reads between more machines, and shards split the writes over more primaries. This simulator shows which lever helps your kind of traffic.
Why it matters
Adding hardware without knowing the bottleneck wastes money. Replicas do nothing for a write-bound database, and a cache does nothing for traffic with no repeated reads. The model is simple, but the habit is how real capacity planning starts: find the busiest machine, then pick the lever that lowers its load.
How real systems do it
The simulation is a simplified model. Here is what production systems add or do.
- Read replicas, caching and sharding are the usual levers, in roughly that order, because each is more work to run than the one before.
- Replicas share reads, but every replica still applies every write, so write-heavy loads need sharding.
- Latency climbs sharply as a machine nears its limit, which is why teams plan to stay well below 100% busy. This model treats 70% as the comfortable ceiling.
- Real capacity planning is driven by load tests and the busiest machine's metrics, not by a model like this one.
Study: Database scaling
Once you have played with it, learn the same idea from people who build these systems. Watch first for the picture, then read for the detail.
 8 min
System Design BASICS: Horizontal vs. Vertical Scaling
Gaurav Sen · 2.0M views
Then
 9 min7 Must-know Strategies to Scale Your DatabaseByteByteGo · 289K views
 17 minHow databases scale writes: The power of the log ✍️🗒️Gaurav Sen · 175K views
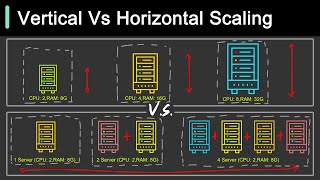 5 minVertical Vs Horizontal Scaling: Key Differences You Should KnowByteByteGo · 105K views
 17 minLearn System design : Distributed Systems Introduction | Horizontal scaling vertical scalingTech Dummies - Narendra Lakshmana Gowda · 85K views