Concept Simulators / Speed and waiting
Tail latency
Why a wide fan-out meets a slow call, and how hedging cuts the tail.
On the roadmap:Beginner · step 1: Think like a designer
Settings
What the request does about it
Typical request
10.0 ms
Slowest 1%
58.9 ms
Meet a slow call
1%
Extra calls sent
none
With one call, 1% of requests meet a slow call. The slowest 1% is 58.9 ms, against a typical 10.0 ms. Now raise the fan-out.
The slowest 1% as a request waits for more calls
response time
In plain words
Most calls to a service are quick and now and then one is slow. If a single request has to wait for many such calls, it meets a slow one far more often than any one call does. The slow tail dominates what users feel.
Why it matters
If 1% of calls are slow, a request that fans out to 100 of them has a 63% chance of hitting at least one. Averages hide this completely, which is why teams watch the 99th percentile. Here you can widen the fan-out, see the tail take over, and try the standard remedies.
How real systems do it
The simulation is a simplified model. Here is what production systems add or do.
- The 2013 paper The Tail at Scale (Dean and Barroso, Google) gives this exact example: if 1% of calls take over a second and a request fans out to 100 servers, 63% of requests take over a second.
- Hedged and tied requests are two techniques from that paper: send a second copy after a short delay, and take whichever answers first.
- Search engines and other systems that query many shards often return partial results rather than wait for the slowest shard.
- Averages hide the tail, so latency targets are written as percentiles: for example 99% of requests under 300 ms.
Study: Tail latency
Once you have played with it, learn the same idea from people who build these systems. Watch first for the picture, then read for the detail.
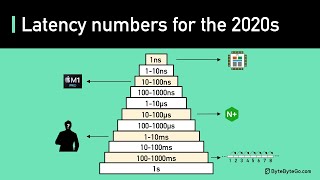 6 min
Latency Numbers Programmer Should Know: Crash Course System Design #1
ByteByteGo · 376K views
Then
 7 minMastering Latency Metrics: P90, P95, P99 | System DesignByteMonk · 38K views
 6 minPercentile Tail Latency Explained (95%, 99%) Monitor Backend performance with this metricHussein Nasser · 32K views
 6 minLatency Numbers Every Programmer Should Know - 1000x slow-downGaurav Sen · 13K views
 51 minWhy a Hedge Fund Built Its Own DatabaseInfoQ · 2K views