Library / Blogs
Implementing health checks
Kinds of health checks, how load balancers use them, and how a careless check can take down a whole fleet.
By Amazon Builders' Library · Amazon Web Services · Added 2026-10-12
All content belongs to Amazon Builders' Library / Amazon Web Services. We only link to it and give credit. Report a problem
Learn this article
About 37 min left. Your work is saved as you go.
What you are about to study
Amazon Web Services wrote this to explain how they thought about a problem. You should know the basics: caching, queues and replication.
Ideas you will meet
- Load Balancer
- Spread traffic across servers with L4/L7 balancing, health checks and algorithms.
- Observability
- Metrics, logs, traces, SLOs and alerting.
- Resilience
- Timeouts, retries, circuit breakers, bulkheads and load shedding.
What we already know about this
Our own lessons on these ideas. Read them here before you start, so it makes sense.
System Design Foundations · 10 minFrom one server to many: scaling and load balancingVertical versus horizontal scaling, why stateless servers matter, and how a load balancer spreads traffic.Read here
Two ways to grow
When one server is not enough you have two options.
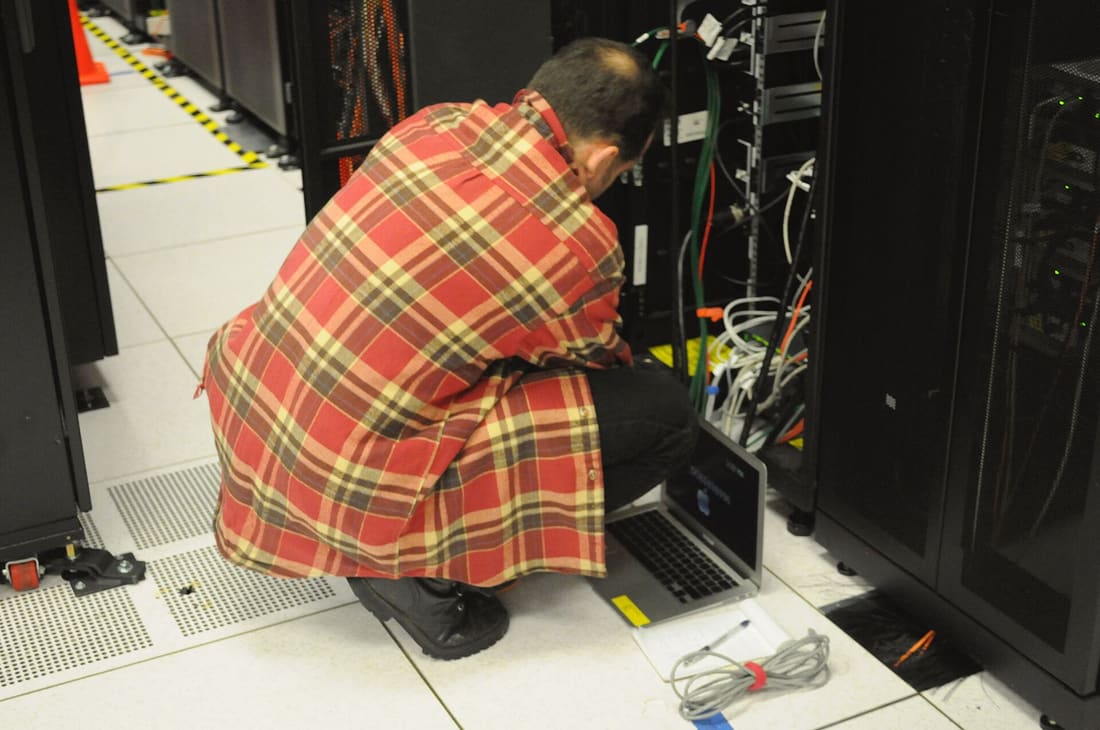 Image: Derrick Coetzee · CC0 · Source · Wikimedia Commons: Technician with laptop working on server rack at NERSC
- Vertical scaling ("scale up"): use a bigger machine with more CPU, memory or disk. It is simple because nothing in the design changes.
- Horizontal scaling ("scale out"): add more machines and share the work between them. It needs more design effort but has no hard ceiling.
Vertical Horizontal Effort Low Higher Ceiling Hardware limit Practically none Failure One machine is a single point of failure Survives losing a machine Cost curve Gets steep for the largest machines Roughly linear with commodity machines Real systems use both: scale up until it gets expensive or risky, then scale out.
100%Figure SDA-FND-02-1 · Scale up versus scale out · © forcsguy.com
What a load balancer does
Once you have several servers, something must decide which one handles each request. That is the load balancer.
100%Figure SDA-FND-02-2 · Load balancer in front of a server pool · © forcsguy.com
It does three jobs:
- Distributes requests so no server is overloaded.
- Checks health. It probes each server regularly and stops sending traffic to ones that fail.
- Hides the pool. Clients talk to one address, and servers can be added or removed without clients noticing.
Common strategies
- Round robin: take turns. Simple and fine when requests are similar.
- Least connections: send to the server with the fewest active requests. Better when request cost varies.
- Hashing (for example on user id or IP): the same key goes to the same server. Useful when a server keeps a local cache for that key.
- Weighted: bigger machines get a bigger share.
Load balancers work at different layers. A layer 4 balancer routes by IP and port and is very fast. A layer 7 balancer reads the HTTP request, so it can route by URL path or header and terminate TLS.
A security benefit comes with this layout: only the balancer needs a public address. The servers behind it use private addresses, reachable from inside the network but not from the internet, so clients cannot bypass the balancer or attack a server directly. If one server goes offline, the balancer sends its traffic to the others and a replacement can join the pool.
Before: one server
100%After: load balancer and several servers
100%What changed
- Traffic is shared across servers
- One server failing no longer takes the site down
- You can add capacity without downtime
Stateless servers make scaling easy
A server is stateless when it keeps nothing about a user between requests. Everything it needs comes from the request or from a shared store.
100%Figure SDA-FND-02-3 · Stateful versus stateless servers · © forcsguy.com
With stateless servers any request can go to any server, so you can add servers at will, replace a failed one without losing data, and run auto-scaling. The state does not disappear. It moves to a database, a cache or a session store, which you then have to scale and protect, which is what the next lessons are about.
Putting it together
A typical first scalable layout:
- Users reach a load balancer.
- It spreads requests over a pool of stateless application servers.
- Servers read and write a shared database (and later a cache).
- Static files such as images and scripts are served from a CDN so the servers do not carry that traffic (lesson 9).
This design handles a surprisingly large amount of traffic. The first thing to give way is usually the database, which is where we go next.
A worked example: how many servers do you need?
Capacity planning is arithmetic you can do on a napkin. Say your product has 5 million daily users and each makes about 20 requests a day.
- Requests per day: 5,000,000 x 20 = 100 million.
- Per second on average: 100,000,000 / 86,400 = about 1,160 requests per second.
- Traffic is not flat. A common rule of thumb is that the busiest second is 2 to 3 times the average, so plan for about 3,500 per second.
- One server handles about 400 requests per second flat out, but you never want servers at 100%: queues build and latency explodes near full load. Plan for roughly 70% utilisation, so 280 requests per second each.
- 3,500 / 280 = 12.5, so 13 servers carry the peak.
- Add spare capacity so you survive failures: with 13 servers, losing 2 leaves 11, which carry only 3,080 requests per second. Plan for N+2: 15 servers.
100%Figure SDA-FND-02-4 · From users to a server count · © forcsguy.com
The same method works for any tier. Only the "requests per server" number changes, and you should measure it with a load test rather than guess.
Choosing a balancing method with real numbers
Round robin is fair in the number of requests, not in the work. Imagine three servers and a stream where most requests take 10 ms but every fifth takes 1 second (a report export, say). Round robin gives each server the same count, but by chance one server collects several slow requests at once, its queue grows, and its users wait while the other two are nearly idle.
Least connections notices: the server with the most open requests gets fewer new ones, so the slow requests spread out as they arrive. It costs the balancer a little bookkeeping and helps most when request costs vary a lot. Use plain round robin when requests are similar and servers identical; use least connections, or "power of two choices" (pick two servers at random and send to the less busy one), when they are not. For caches and stateful workloads, consistent hashing keeps the same key on the same server so its memory stays useful.
Health checks and draining
A balancer is only as good as its knowledge of which servers are alive.
- Active health checks call a lightweight endpoint (for example
/health) every few seconds. After two or three failures in a row, the server leaves rotation; after a few successes it returns. Make the check reflect real readiness: a server that is up but cannot reach its database should fail the check. - Passive checks watch real traffic: too many errors or timeouts from one server and it is ejected.
- Connection draining matters at deploys. Before stopping a server, tell the balancer to send it no new requests, let in-flight requests finish (typically 30 to 60 seconds), then stop it. Without draining, every deploy drops a few user requests.
100%Figure SDA-FND-02-5 · Rolling out a new version without dropping requests · © forcsguy.com
Mistakes people make
- Treating the balancer as magic. It is a server too and can be a single point of failure. Run at least two, or use a managed one.
- Adding servers behind a single database. App servers scale out easily; if the database is the bottleneck, more app servers only make it fail faster.
- Keeping state on the server. Sessions, uploads and caches held in one server's memory break the moment a request lands elsewhere. Move them to a shared store.
- Sizing for the average. The system fails at peak, which is when it matters.
- Never testing failure. Kill a server during a load test. If users notice, you have found a gap before they did.
Try it yourself
Open the System Builder challenge "One server is not enough". Run the test on one server and watch it fail, add a load balancer without adding servers, then add servers and see where the numbers settle. Or skip the challenge and open a load-balanced system on the free canvas, then change the wiring yourself.
More on this site
Related reading
- Maglev: A Fast and Reliable Software Network Load Balancer (paper)Eisenbud et al. · GooglePapers
- NGINX HTTP Load BalancingNGINX · F5 / NGINXDocumentation
- Google SRE Book: Load Balancing in the DatacenterGoogle SRE team · GoogleBlogs
- Scaling Load Balancing Infra to Support 1.3 Billion Users at Facebook - Patrick Shuff, Production Engineer at FacebookFacebookYouTube
Show 6 moreShow fewer
- Load Balancing infrastructure to support more than 1.3 billion users at FacebookFacebook engineers · FacebookCase Studies
- Implementing health checksAmazon Builders' Library · Amazon Web ServicesBlogs
- Awesome System Design ResourcesAshish Pratap Singh · ashishps1GitHub
- Load Balancing at GithubGithub engineers · GithubCase Studies
- Google Cloud Architecture FrameworkGoogle · Google CloudDocumentation
- HAProxyHAProxy Technologies · HAProxyDocumentation
Advanced Distributed Systems · 12 minLoad balancing: layer 4, layer 7 and gatewaysWhat a load balancer can see and do at each layer, the algorithms behind it, and how API gateways add routing, aggregation and policy.Read here
What a load balancer sees
A load balancer spreads incoming work across servers, removes failed servers and makes scaling invisible to clients. What it can do depends on which layer it works at.
Layer 4 (transport) Layer 7 (application) Sees IP addresses, ports, TCP/UDP connections HTTP method, URL, headers, cookies, body Decides by Connection details Request content TLS Passes through, or terminates in some products Usually terminates TLS Speed and cost Very fast, low overhead More work per request Typical features Spread connections, health checks Path routing, header rules, sticky sessions, rewrites, caching, WAF rules Examples Network load balancers, LVS, HAProxy in TCP mode NGINX, Envoy, HAProxy HTTP mode, cloud application balancers 100%Figure SDA-ADS-05-1 · Layers of balancing in front of an app · © forcsguy.com
Many designs use both: an L4 tier for raw scale and an L7 tier for smart routing.
Before: layer 4: ports and addresses
100%After: layer 7: reads the request
100%What changed
- Layer 7 can route by path, header or cookie
- Layer 7 can terminate TLS and retry safely
- Layer 4 is simpler and faster, with less to configure
Choosing a target: algorithms
- Round robin / weighted round robin: simple rotation; weights favour bigger machines.
- Least connections (and weighted): send to the server with fewest active requests; good when requests vary in length.
- Least response time: combine active load with measured latency.
- IP hash / consistent hashing: the same client or key goes to the same server, useful for caches and sticky state (see consistent hashing).
- Resource-based: servers report load and the balancer follows.
Health checks (active probes and passive error tracking) remove unhealthy servers; connection draining lets in-flight requests finish before a server is removed during a deploy.
Global and DNS balancing
Across regions, DNS-based or global server load balancing directs users to the nearest or healthiest region (see the DNS and CDN lessons). DNS answers are cached, so failover takes as long as the TTL; anycast and global balancers react faster.
API gateway: policy at the edge
An API gateway is an L7 component specialised for APIs. Beyond routing it commonly provides:
- Authentication and authorisation (validate tokens, apply scopes),
- Rate limiting and quotas (see the rate-limiter lesson),
- Request and response transformation, versioning, and protocol translation,
- Aggregation: one client call fans out to several services and merges results, saving round trips for mobile clients,
- Caching, logging, metrics and tracing in one place.
100%Figure SDA-ADS-05-2 · Gateway routing and aggregation · © forcsguy.com
Risks: the gateway is a single entry point (run several instances, keep it stateless) and can become a bottleneck or a place where business logic piles up. Keep it to cross-cutting concerns. A variation is a backend for frontend: one gateway per client type (web, mobile) tailored to its needs.
Inside the cluster
Between services, balancing is done by client-side libraries or sidecar proxies that know the healthy instances from service discovery, so no central balancer is needed for east-west traffic. See the microservices lessons for service mesh ideas.
Failure habits
- Run at least two of every balancer and gateway instance across zones.
- Keep timeouts and retry budgets (see the resilience lesson) so the balancer does not amplify an outage.
- Use slow start for new instances so they warm up before taking a full share.
Real-world reading
Related reading
- Maglev: A Fast and Reliable Software Network Load Balancer (paper)Eisenbud et al. · GooglePapers
- NGINX HTTP Load BalancingNGINX · F5 / NGINXDocumentation
- Scaling Your API with Rate LimitersPaul Tarjan · StripeBlogs
- Active-Active for Multi-Regional ResiliencyNetflix Engineering · NetflixCase Studies
Show 6 moreShow fewer
- ByteByteGo: System Design Video SeriesAlex Xu · ByteByteGoYouTube
- Rate Limiting with NGINXNGINX · F5 / NGINXBlogs
- Implementing health checksAmazon Builders' Library · Amazon Web ServicesBlogs
- Google SRE Book: Load Balancing in the DatacenterGoogle SRE team · GoogleBlogs
- Traffic Steering using Rum DNS at LinkedInLinkedIn engineers · LinkedInCase Studies
- Google SRE BookBetsy Beyer et al. · GoogleCourses
System Design Foundations · 9 minObservability and running a systemMetrics, logs and traces, how to define 'healthy' with SLOs, and how to ship changes without breaking things.Read here
You cannot fix what you cannot see
A system you cannot observe is a system you cannot trust. Observability is the ability to understand what is happening inside from the outside. Three kinds of signal work together.
Signal What it is Best for Metrics Numbers over time (requests per second, error rate, CPU) Dashboards, alerts, trends Logs Timestamped records of events Details of what happened Traces The path of one request through many services Finding where time is spent 100%Figure SDA-FND-11-1 · From alert to root cause · © forcsguy.com
What to measure
A simple checklist, the four golden signals:
- Latency: how long requests take (use percentiles).
- Traffic: how much demand there is.
- Errors: how many requests fail.
- Saturation: how full the busiest resource is (CPU, memory, connections, disk, queue depth).
Averages hide pain. If the average is 100 ms but p99 is 4 seconds, one user in a hundred is waiting four seconds, and with many requests per page that is most of your users sometimes.
Defining healthy: SLIs, SLOs, error budgets
- An SLI (indicator) is a measurement, like "fraction of requests answered successfully in under 300 ms".
- An SLO (objective) is the target, like "99.9% over 30 days".
- The error budget is what is left over: 0.1% of requests may fail. While there is budget, ship features; when it runs out, focus on reliability.
Alert on symptoms users feel (error rate, latency) more than on causes (one machine's CPU). Page a human only for things that need action now.
Ship changes safely
Most outages come from changes. Reduce the risk:
- Small, frequent releases are easier to understand and undo than big ones.
- Canary release: send a few percent of traffic to the new version and watch the metrics before going wider.
- Feature flags: deploy code turned off, then enable it gradually, and switch it off instantly if needed.
- Blue-green: keep the old version running so you can switch back in seconds.
- Backwards-compatible changes: database and API changes should work with both old and new code during rollout.
- Fast rollback must be a rehearsed, boring button.
When things go wrong
Have an incident process: someone leads, someone communicates, mitigate first and investigate later. Afterwards write a blameless postmortem that asks "how did our system and process allow this?" rather than "who did this?". That is how reliability actually improves.
A worked example: error budgets and burn rate
Your service has an SLO of 99.9% of requests succeed over 30 days, and it serves 10 million requests a month.
- Error budget: 0.1% of 10,000,000 = 10,000 failed requests may happen in the month before you break the promise.
- Burn rate is how fast you spend it. A burn rate of 1 uses exactly the budget over 30 days. If 5% of requests are failing now, the error rate is 50 times the allowed 0.1%, a burn rate of 50: the whole month's budget is gone in 30 / 50 = 0.6 days, about 14 hours.
- Alert on burn rate, not on a single bad minute. A common pattern watches two windows together: page someone if the burn rate over the last hour is above about 14 and the last 5 minutes agree (a fast burn: 2% of the monthly budget gone in an hour). Open a ticket for a slower burn, say rate above 6 over 6 hours. Two windows avoid paging for blips and avoid missing slow leaks.
Why this beats "alert when error rate is above X": it ties alerts to what users were promised, it pages only when the budget is in danger, and it gives the team a rule for trade-offs: when the budget is healthy, ship faster; when it is nearly spent, slow down and fix reliability.
100%Figure SDA-FND-11-2 · Alerting on how fast the error budget burns · © forcsguy.com
Finding the cause with all three signals
A worked investigation shows why you want metrics, traces and logs together.
- A metric alerts: the checkout success rate dropped and p99 latency rose. Metrics tell you that something is wrong and how bad, cheaply and over time.
- Narrow it down by dimension: break the metric down by region, version and endpoint. Only the new version in one region is affected, a strong hint it is a deploy.
- A trace shows where the time goes: one slow checkout request shows 4.8 of its 5 seconds in a call to the payment provider's tokenisation endpoint.
- Logs give the detail: filter logs by the trace id from that request and read the exact error: a timeout talking to a new tokenisation URL.
- Fix and verify: roll back the version, and watch the metric recover.
100%Figure SDA-FND-11-3 · From an alert to a root cause · © forcsguy.com
The glue is a correlation id (trace id) carried on every request and written into every log line, so you can jump from one signal to the others.
Mistakes people make
- Alerting on causes instead of symptoms. "CPU is 85%" may be fine; "users are seeing errors" never is. Page on symptoms users feel, and use cause metrics for diagnosis.
- Averaging percentiles. The mean of two hosts' p99 is meaningless; merge distributions instead (see the t-digest lesson).
- High-cardinality labels. A label such as
user_idon a metric creates a new time series per user, which can multiply storage and cost by millions. Put such detail in logs or traces. - Logs without structure or ids. Free text is hard to query. Log JSON with a trace id, service and version.
- Dashboards no one owns. A wall of graphs nobody reads is noise. Build a small dashboard per service around the golden signals: latency, traffic, errors and saturation.
- No runbook. An alert that does not say what to check first wastes the first ten minutes of every incident.
Try it yourself
Run any test in the System Builder and read its charts as if they were production graphs: which signal moves first, and which part would you look at next? Build the search metrics lab to practise percentile maths, and read the t-digest lesson for how real systems summarise latency at scale.
Real-world reading
Related reading
- The Site Reliability WorkbookGoogle SRE team · O'Reilly / GoogleBooks
- Feature Toggles (aka Feature Flags)Pete Hodgson · Martin FowlerBlogs
- InfluxData BlogInfluxData engineers · InfluxDataBlogs
- MetricsDB: TimeSeries Database for storing metrics at TwitterTwitter engineers · TwitterCase Studies
Show 6 moreShow fewer
- The Architecture Twitter Uses to Deal with 150M Active Users, 300K QPS, a 22 MB/S Firehose, and Send Tweets in Under 5 SecondsHigh Scalability engineers · High ScalabilityCase Studies
- Steady State: Always Put Logs on Separate DiskMicrosoft engineers · MicrosoftCase Studies
- XCMetrics: All-in-One Tool for Tracking Xcode Build Metrics at SpotifySpotify engineers · SpotifyCase Studies
- Honeycomb BlogHoneycomb engineers · HoneycombBlogs
- BookKeeper: Distributed Log Storage at YahooYahoo engineers · YahooCase Studies
- Analyzing V8 Garbage Collection Logs at AlibabaAlibaba engineers · AlibabaCase Studies
Go deeper on this
A path through videos, articles, other case studies and code on the same ideas as Implementing health checks.
Warm upGet the vocabulary first.
Books · Free from the author
Site Reliability Engineering
How Google runs production systems: SLOs, error budgets, monitoring and incident response. Free to read online from Google.
GoogleIntermediate
Books · Free from the author
The Site Reliability Workbook
The practical companion to the SRE book, with worked examples of SLOs, alerting and incident response.
O'Reilly / GoogleIntermediate
WatchHow others solve the same problem, on video.
Videos belong to their creators and play from YouTube. More on YouTube (opens in a new tab)
ReadEngineers explain it in their own words.
Blogs
Google SRE Book: Embracing Risk
Why 100 percent reliability is the wrong goal and how error budgets balance reliability against speed.
GoogleIntermediate
Blogs
PagerDuty Blog
Welcome to PagerDuty’s Engineering Blog! Here you’ll find curated, technical content from our internal engineering team.
PagerDutyIntermediate
See it in another companyThe same ideas, a different system.
Case Studies · Read here
Monitor DNS systems at Stripe
The secret life of DNS packets: investigating complex networks.
StripeIntermediate
Case Studies · Read here
GitHub Availability Report: June 2023
A real incident write-up, useful as an example of how to explain causes and follow-ups.
GitHubIntermediate
Read the codeSee how it looks when it is real.
GitHub
Chaos Monkey (source)
The source of Netflix's tool for randomly terminating instances to test resilience.
GitHubIntermediate
GitHub
Jaeger
A distributed tracing system modelled on Dapper.
GitHubIntermediate
Keep learning
Loading community…